The challenge isn't a lack of data. It's the opposite. CRMs generate dozens of reports, dashboards show endless charts, and every platform claims to surface "actionable insights." But which metrics actually move the needle? Which KPIs tell you whether your reps are building pipeline or just staying busy? The difference between a high-performing sales org and a struggling one often comes down to measuring what matters, and ignoring the noise.
This guide breaks down the specific KPIs you should track, how to interpret them, and what actions to take based on the results. We built Vedain CRM with built-in pipeline reports, conversion funnels, and team leaderboards specifically because we saw sales leaders spending more time assembling data than acting on it. Every metric covered here is one you can track directly inside your CRM, no spreadsheets, no guesswork. Whether you manage a team of five or fifty, these are the performance indicators that separate opinion from evidence.
What good sales performance measurement looks like
Good measurement isn't about tracking every number your CRM generates. It's about choosing a focused set of metrics that together tell you where revenue is coming from, where it's getting stuck, and which reps need support. When you understand how to measure sales team performance properly, you can separate reps who are genuinely building pipeline from those who are just logging activity. The distinction matters because a rep with 100 calls and zero qualified meetings is performing differently than a rep with 60 calls and 12 qualified meetings, even though both look equally busy in a surface-level report. Good measurement makes that difference visible before the quarter ends.
Leading vs. lagging indicators
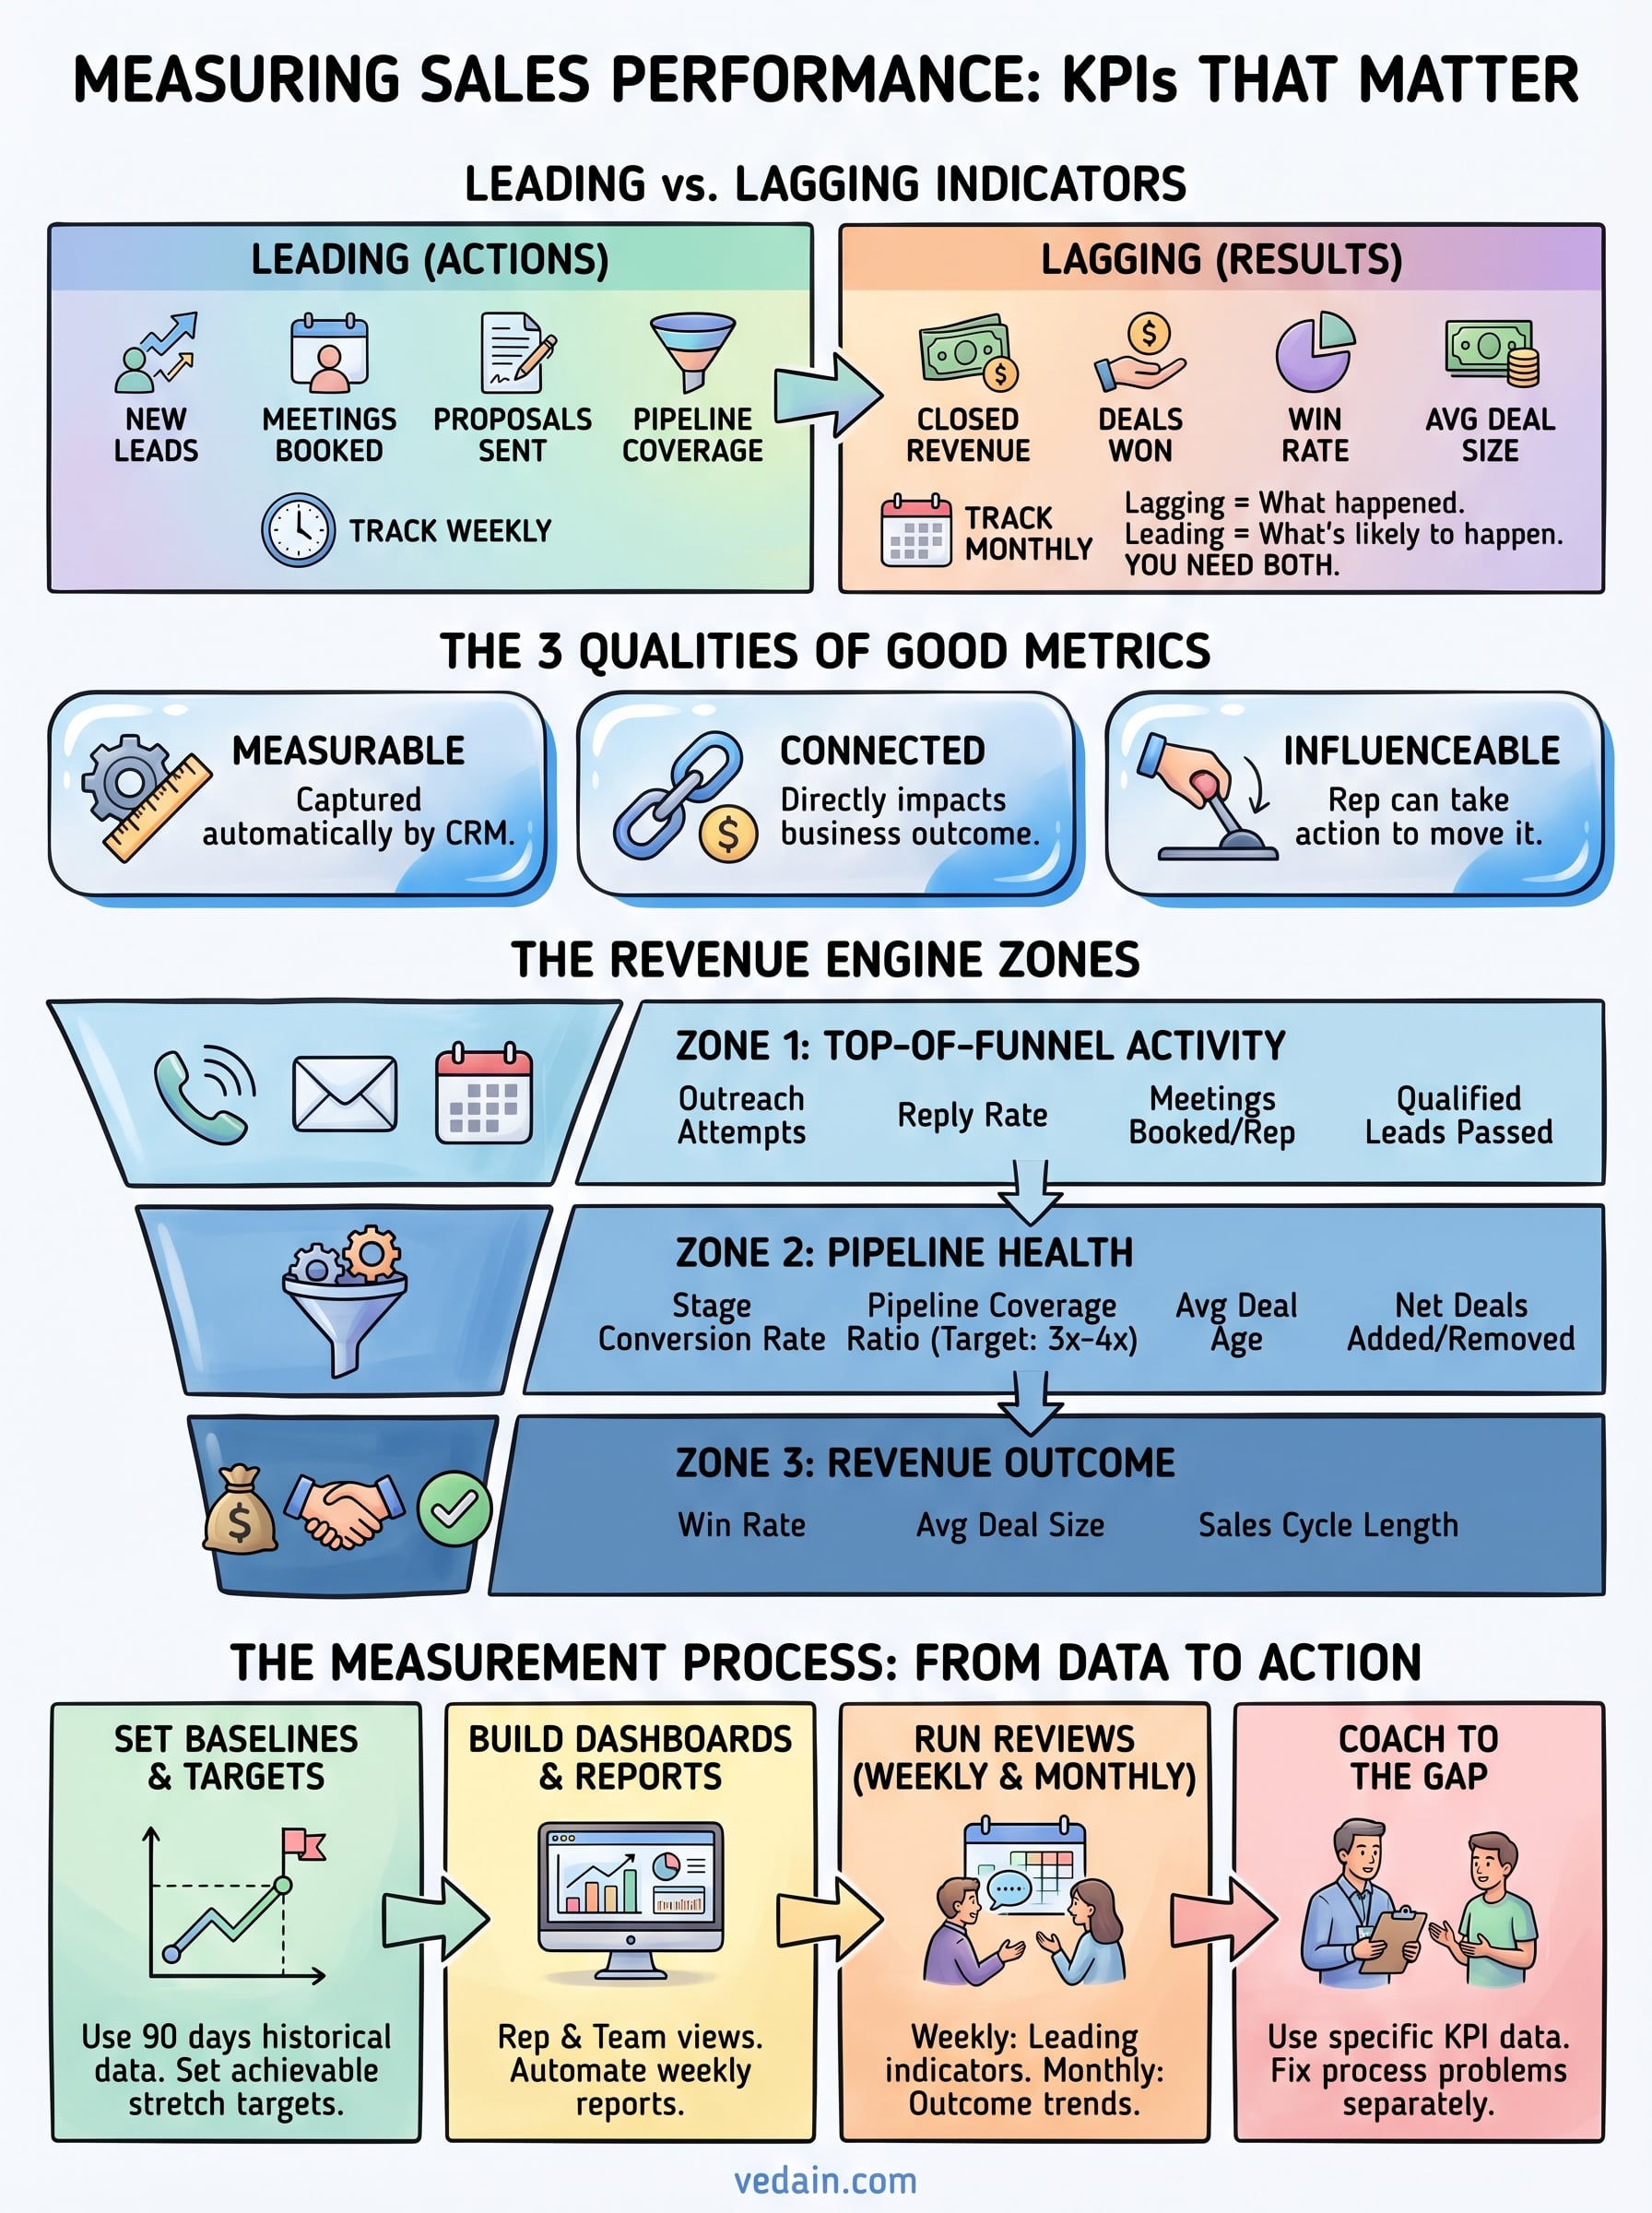
The most important concept in sales measurement is the split between leading and lagging indicators. Lagging indicators tell you what already happened: closed revenue, deals won, quota attainment. These numbers matter, but by the time they appear in your reports, the outcome is already locked in. Leading indicators tell you what is likely to happen: qualified leads added, meetings booked, proposals sent, pipeline coverage ratio. These are the numbers that give you time to act.
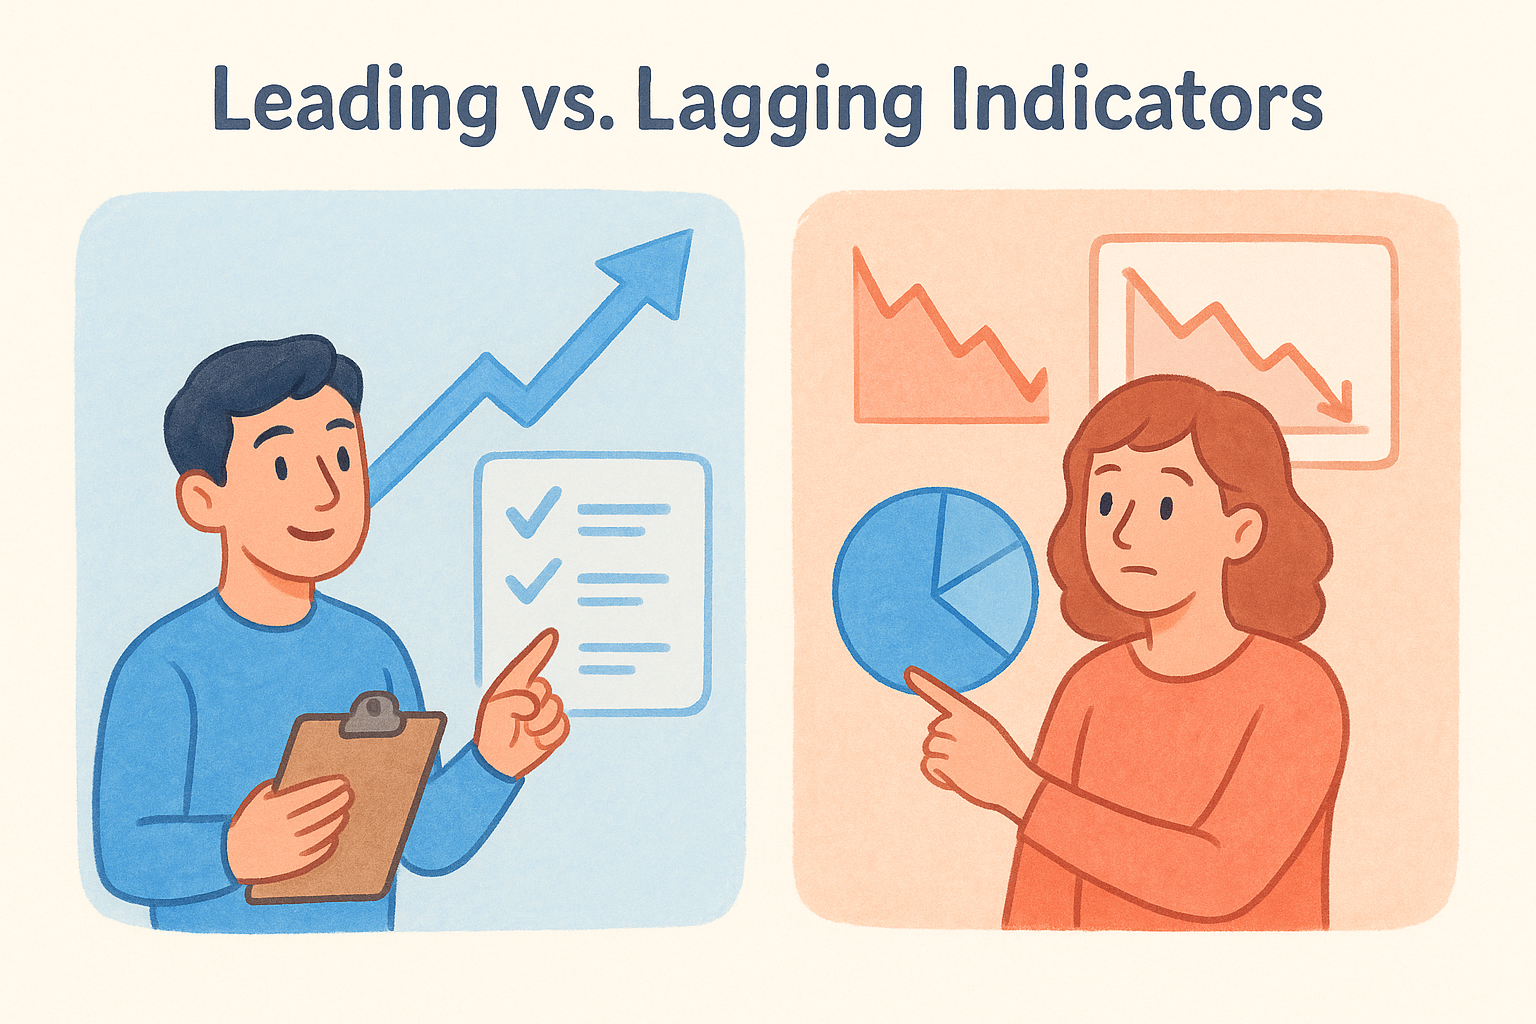
Track leading indicators weekly. If you wait for lagging indicators to surface a problem, you are already a quarter behind and out of options.
A useful way to think about it: lagging indicators measure results, leading indicators measure behavior. You need both. Tracking only revenue tells you whether your team won or lost, but not why. Tracking only activity tells you your reps are busy, but not whether that activity converts into anything. The table below shows common examples of each category so you can start sorting your current metrics accordingly:
The three qualities every good sales metric shares
Not every metric worth knowing about belongs in your weekly performance review. Good sales metrics share three qualities: they are measurable without manual effort, they connect directly to a business outcome, and your team can actually influence them. A metric like "brand sentiment" might matter to marketing, but it does not belong in a sales performance dashboard because a rep cannot move it during a prospecting session on Wednesday morning.
Before adding any KPI to your system, run it through a quick filter. Ask three questions: Can your CRM capture this automatically? Does improving this metric lead to more revenue? Can a rep or manager take a specific action this week to move it in a positive direction? If the answer to any of those is no, that metric belongs somewhere else, not in the dashboard your team looks at every review cycle.
Applying this filter keeps your reporting focused and prevents the common trap of tracking vanity numbers that produce impressive-looking charts and zero behavioral change. The goal of measurement is action, not a fuller spreadsheet. Once you build your metric list around this standard, the reviews become shorter, the coaching becomes sharper, and the team knows exactly what they are being evaluated on.
Step 1. Align on goals, roles, and your sales process
Before you measure anything, you need clarity on what your team is trying to accomplish and how deals move through your pipeline. Understanding how to measure sales team performance starts with this alignment step because a metric only means something when it connects to a defined goal and a documented process. Without that foundation, you end up tracking numbers in isolation and drawing conclusions that do not hold up when you try to act on them.
Define your team's goals before picking metrics
Every rep on your team should know their quarterly revenue target, the number of new deals they are expected to close, and the activity benchmarks they are held to each week. These goals must be concrete and written down. "Grow revenue" is not a goal. "Close $90,000 in new business by June 30 with an average deal size of $6,000" is a goal you can build metrics around and hold someone accountable to.
A vague goal produces vague measurement. Write every target in a format that includes a specific number, a timeframe, and a named owner.
Clarify which roles own which stages
Different roles in your sales process own different parts of the pipeline. SDRs own top-of-funnel activity: outreach volume, meetings booked, and qualified leads passed to account executives. AEs own mid-to-bottom-funnel metrics: conversion rates, proposal-to-close ratio, and average deal size. If one person handles the full cycle, you still need to separate these stages so you can pinpoint exactly where performance breaks down when results slip.
Use a simple ownership table like this one to map it out for your team:
Document your actual sales process stages
Your CRM pipeline should reflect the real steps a deal takes from first contact to closed-won, not an idealized version someone built during setup. Walk through five recent deals that closed in the last 90 days, note every step that actually occurred, and use that list to define your pipeline stages. If your CRM shows six stages but reps skip two of them on every deal, your stage-by-stage conversion data is unreliable from the start.
Step 2. Choose KPIs that cover the full revenue engine
Once your goals and process are documented, you can pick the right metrics. The key to understanding how to measure sales team performance is treating your revenue operation as a system with three zones: activity at the top, pipeline health in the middle, and closed outcomes at the bottom. Each zone needs its own set of metrics, because a gap in any one zone will cause deals to stall or disappear before they ever hit your revenue report.
Top-of-funnel activity KPIs
These metrics measure what your reps are doing to generate pipeline. They include outreach volume, connection rate, and meetings booked per rep per week. Track these by individual rep so you can spot who consistently generates qualified conversations versus who stays busy without results.
If meetings booked drops two weeks in a row, you have a pipeline problem that will show up in revenue six to eight weeks later.
Here are the core activity KPIs to track:
- •Outreach attempts per rep per week (calls + emails + LinkedIn touches combined)
- •Reply rate (replies divided by total outreach attempts)
- •Meetings booked per rep per week
- •Qualified leads passed to the next pipeline stage
Pipeline health KPIs
Pipeline metrics tell you whether the deals in your funnel are real and moving. Stage-by-stage conversion rate shows exactly where deals stall. Pipeline coverage ratio (total open pipeline value divided by your revenue target) tells you whether your team has enough live opportunities to hit the number even if some fall through. A healthy coverage ratio typically sits between 3x and 4x your target for the period.
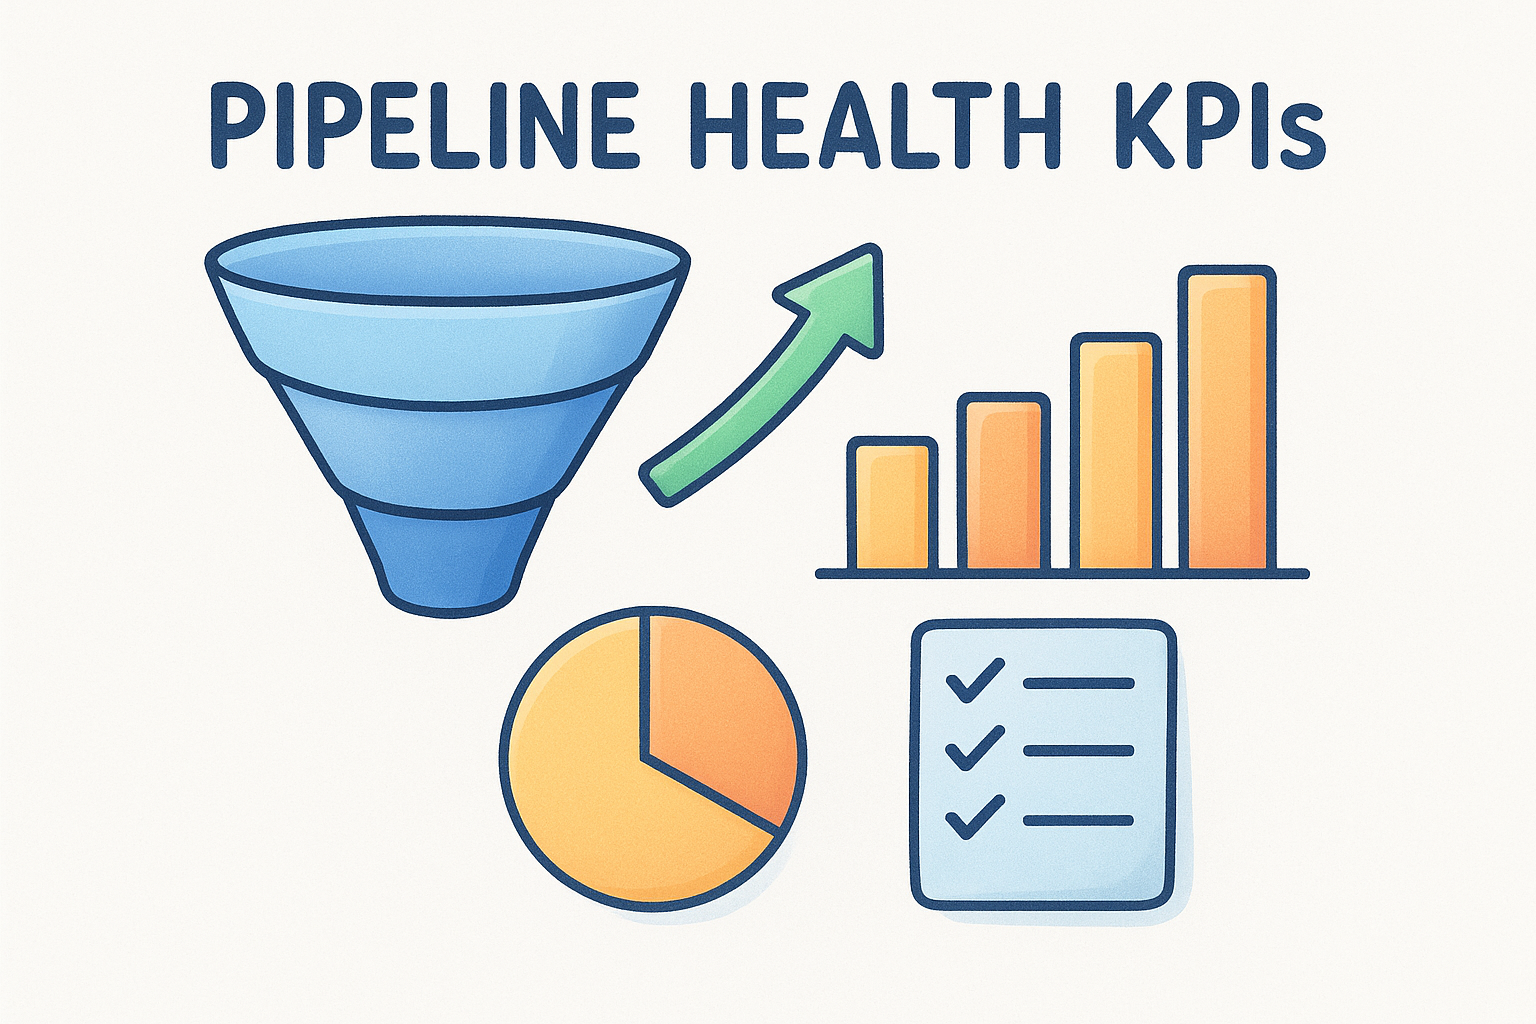
Track these pipeline KPIs every week without exception:
- •Stage conversion rate (for example, proposal sent to closed-won)
- •Pipeline coverage ratio per rep and for the full team
- •Average deal age by stage (flags stuck deals before they go cold)
- •Net deals added vs. removed each week
Revenue outcome KPIs
Outcome KPIs confirm whether your activity and pipeline health translated into actual results. The three that matter most are win rate, average deal size, and sales cycle length. Together, these numbers tell you if your team closes efficiently, at the right price point, and within a timeline your business can sustain. Review them monthly, not just at quarter end, so you catch downward trends while you still have time to reverse them.
Step 3. Set baselines, targets, and benchmarks
You cannot set a meaningful target without first knowing where you currently stand. Before you build any goal into your CRM or performance review, pull 90 days of historical data for each KPI you selected in step two. That number becomes your baseline, the honest starting point every future measurement compares against. Skipping this step is the most common reason sales targets feel arbitrary and teams stop trusting the numbers.
Establish your current baseline first
Your baseline answers one question: what does normal actually look like for your team right now? Pull the last 90 days of data for each KPI and record the average. If you have a small sample or a new team, use 60 days instead. Do not use a single record-breaking week as your starting point because that produces targets no one can sustain.
Use this template to document your baselines before setting any targets:
Set targets that stretch without breaking
Once you have your baseline, set a target that is 10 to 20 percent above it for activity and pipeline KPIs. That range pushes reps to improve without creating goals that demoralize the team from week one. For outcome KPIs like win rate, a 5 percent improvement over 90 days is already meaningful progress worth recognizing.
Targets set without a baseline are just guesses. Guesses do not build accountability.
Document every target next to its baseline so reps can see exactly how big the gap is and what closing it would mean for their quota. When both numbers sit side by side, the target stops feeling like something handed down from management and starts feeling like a logical next step.
Use benchmarks to add external context
Benchmarks give you a reference point outside your own historical data. Common B2B sales benchmarks include a win rate between 20 and 30 percent and a pipeline coverage ratio of 3x to 4x. Use these figures to understand how to measure sales team performance relative to market standards, not to replace your internal targets.
If your win rate sits at 15 percent, the benchmark tells you there is room to grow. Your baseline tells you where to start, and the benchmark tells you how far the ceiling goes. Review benchmarks quarterly rather than weekly so short-term fluctuations do not distort your longer-term goals.
Step 4. Track performance in dashboards and reports
Setting baselines and targets only works if your team can see the numbers update regularly. Dashboards and reports are what turn a list of KPIs into a living system your managers and reps can act on every week. Without a reliable reporting setup, even the best metric selection becomes guesswork because data stays buried inside your CRM instead of surfacing where decisions actually get made. Knowing how to measure sales team performance means nothing if the numbers never reach the people who can act on them.
Build a dashboard your team actually uses
Your main sales dashboard should display no more than eight to ten KPIs at a time. More than that and attention scatters, reps stop checking it, and the dashboard becomes background noise. Organize the layout in three rows: activity metrics at the top, pipeline health in the middle, and revenue outcomes at the bottom. That order mirrors the flow of your sales process, so anyone reading it can trace a performance problem from cause to effect in a single view.
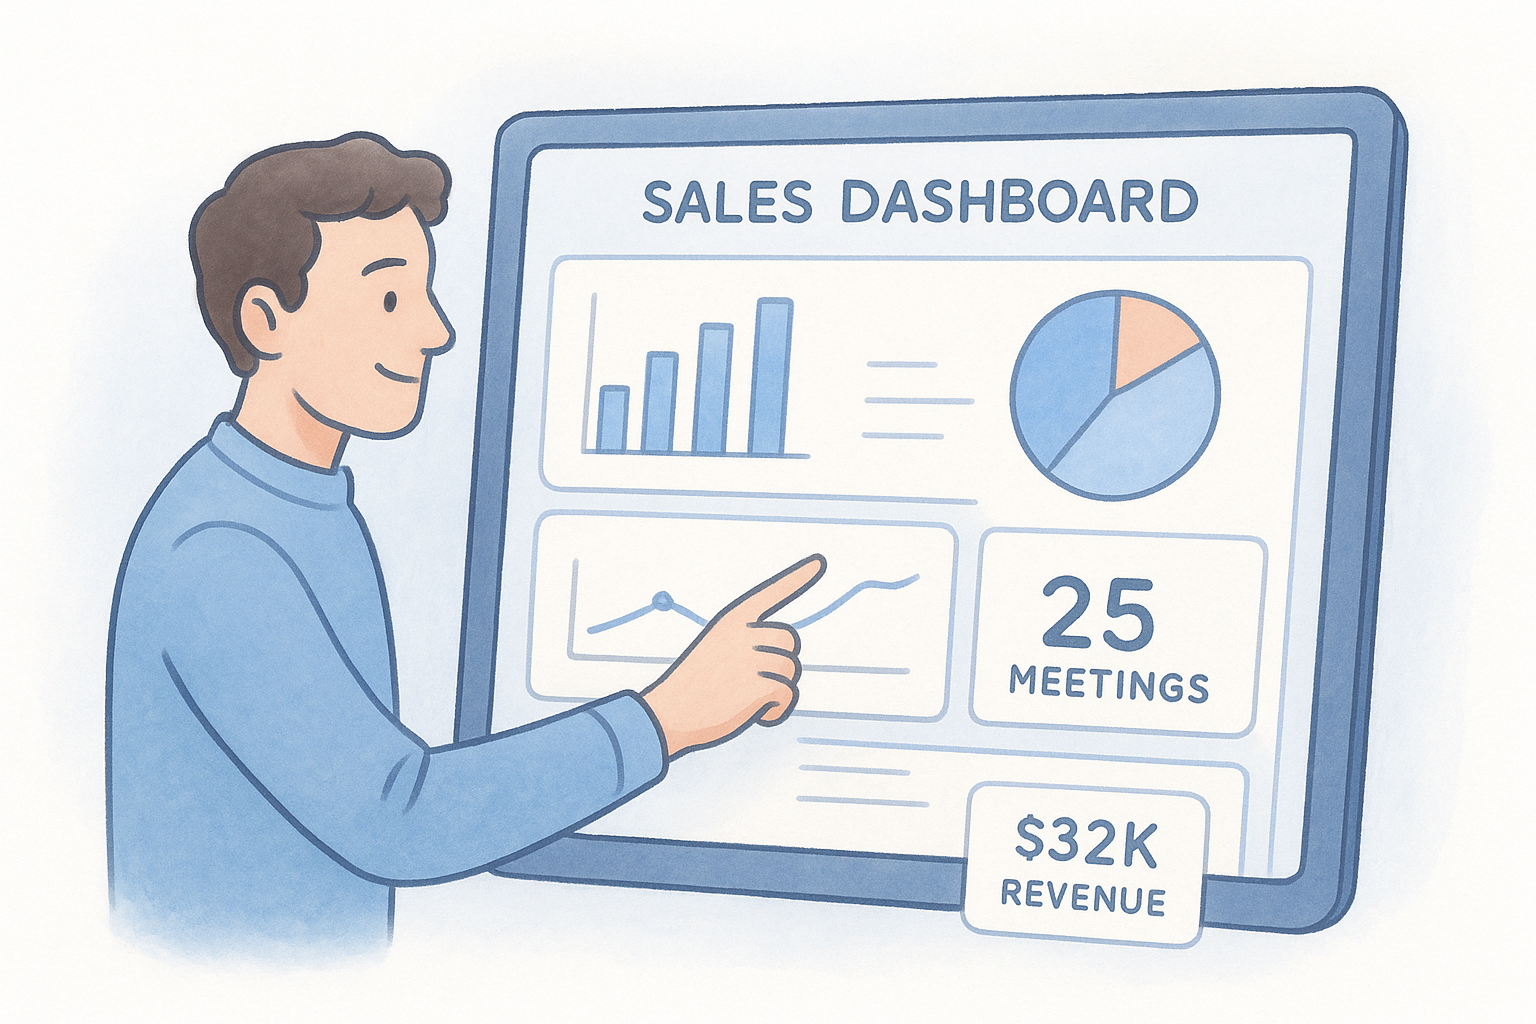
A dashboard no one checks is not a dashboard. It is a report with more colors.
Separate rep-level and team-level views
Team-level dashboards show aggregate pipeline, total meetings booked, and combined revenue toward target. Rep-level dashboards show each individual's activity volume, conversion rates, and pipeline value. Both views serve different audiences. Managers use the team view to spot systemic problems, while reps use their individual view to self-manage and track progress toward personal targets between coaching sessions.
Use the table below as your starting template when configuring each view:
Automate your reports so nothing slips
Automated weekly report emails remove the manual step of pulling data before every review meeting. Configure your CRM to send each rep their individual performance summary every Monday morning and deliver the team summary to managers at the same time. Scheduling this delivery means your reviews start with everyone already oriented to the numbers, which cuts meeting time and keeps the focus on decisions rather than data assembly.
Step 5. Run a weekly and monthly review cadence
Dashboards and reports show you the data, but a consistent review cadence is what turns that data into decisions. Knowing how to measure sales team performance means nothing without a rhythm that keeps your team accountable between quarters. Without scheduled reviews, numbers drift, problems compound, and reps lose sight of their targets until it is too late to course-correct.
Run a weekly check-in focused on leading indicators
Your weekly review should take no longer than 30 minutes and focus exclusively on leading indicators. That means activity volume, meetings booked, qualified leads passed, and pipeline coverage. These are the numbers your team can still influence this week, which makes them the only ones worth discussing in a short weekly format. Save outcome KPIs for the monthly session.
A weekly review that runs over 30 minutes is covering too many topics. Narrow it down to the three leading indicators that most directly predict your team's results this month.
Use this agenda template for every weekly review:
Send this agenda to every rep 24 hours before the meeting so everyone arrives with their numbers ready and the session stays on track.
Run a monthly review focused on outcomes and trends
Monthly reviews look backward at lagging indicators and forward at whether your team's current trajectory will hit the quarter's goal. Pull win rate, average deal size, sales cycle length, and revenue versus target for the full month. Compare each number against your established baseline and target from step three to see whether performance is improving, flat, or declining.
Structure each monthly review around three questions: Which metric moved the most since last month? Which rep showed the biggest gap between activity and outcomes? Where in the pipeline did the most deals stall or drop? Answering these three questions in order gives you the pattern, the individual coaching priority, and the process fix to address in the following month.
Step 6. Turn KPI insights into coaching and fixes
Data without action is just a report. This final step is where knowing how to measure sales team performance actually pays off. When your dashboards and reviews surface a gap, your job is to diagnose the root cause fast and respond with a specific change, whether that is a coaching conversation, a process tweak, or a tool adjustment. Skipping this step turns your entire measurement system into an expensive scoreboard that nobody learns from.
Coach to the gap, not the person
Every performance gap in your KPIs has a specific cause. Before you pull a rep into a coaching session, identify exactly which metric is off and compare it against their activity data to find the disconnect. A rep with strong outreach volume but a low meeting booking rate has a messaging or targeting problem. A rep with strong meetings booked but a low proposal-to-close rate has a qualification or objection-handling problem. Those two situations require completely different conversations.
Coaching without a specific metric to reference is just a pep talk. Bring one KPI and one example to every coaching session.
Use this coaching template to keep sessions focused and consistent:
Fix process problems separately from rep problems
When the same KPI gap appears across three or more reps simultaneously, the problem is almost never individual performance. It is a process failure or a missing resource. If five reps all have a low proposal-to-close rate in the same month, your proposal template, pricing structure, or follow-up sequence likely needs revision, not your reps. Treat team-wide patterns as process tickets, not coaching opportunities.
Review your team-level KPIs each month specifically to separate individual coaching needs from systemic fixes. Document every process change you make and track whether the target KPI improves over the following 30 days. That closed loop is what turns your measurement system from a reporting exercise into a continuous improvement engine your entire team benefits from.
Put your KPIs to work
You now have a complete system for how to measure sales team performance: aligned goals, a focused KPI set, documented baselines, a working dashboard, a structured review cadence, and a coaching framework tied directly to the numbers. Each step builds on the last, so skipping any one of them weakens the whole system. The reps who hit quota consistently are almost always the ones whose managers track the right metrics and respond to gaps before they compound into missed quarters.
Start this week by pulling 90 days of historical data for the six core KPIs covered in step two, then set your baselines before adding any targets. That single action separates teams that measure with intent from teams that report without direction. If you want a CRM that surfaces these metrics automatically without manual setup, start your free trial of Vedain CRM and have your first dashboard running in under five minutes.